Web apps in R with Shiny
2020-08-22
1 / 48
apps/goog-index/app.R
2 / 48
Web apps in R
Reactivity
3 / 48
Web apps in R
Reactivity
Design and User Interface (UI)
4 / 48
Web apps in R
Reactivity
Design and User Interface (UI)
Dashboards
5 / 48
Your Turn 1
Open a new Shiny file (file > New File > Shiny Web App)
Run the app
Stop the app from running
6 / 48
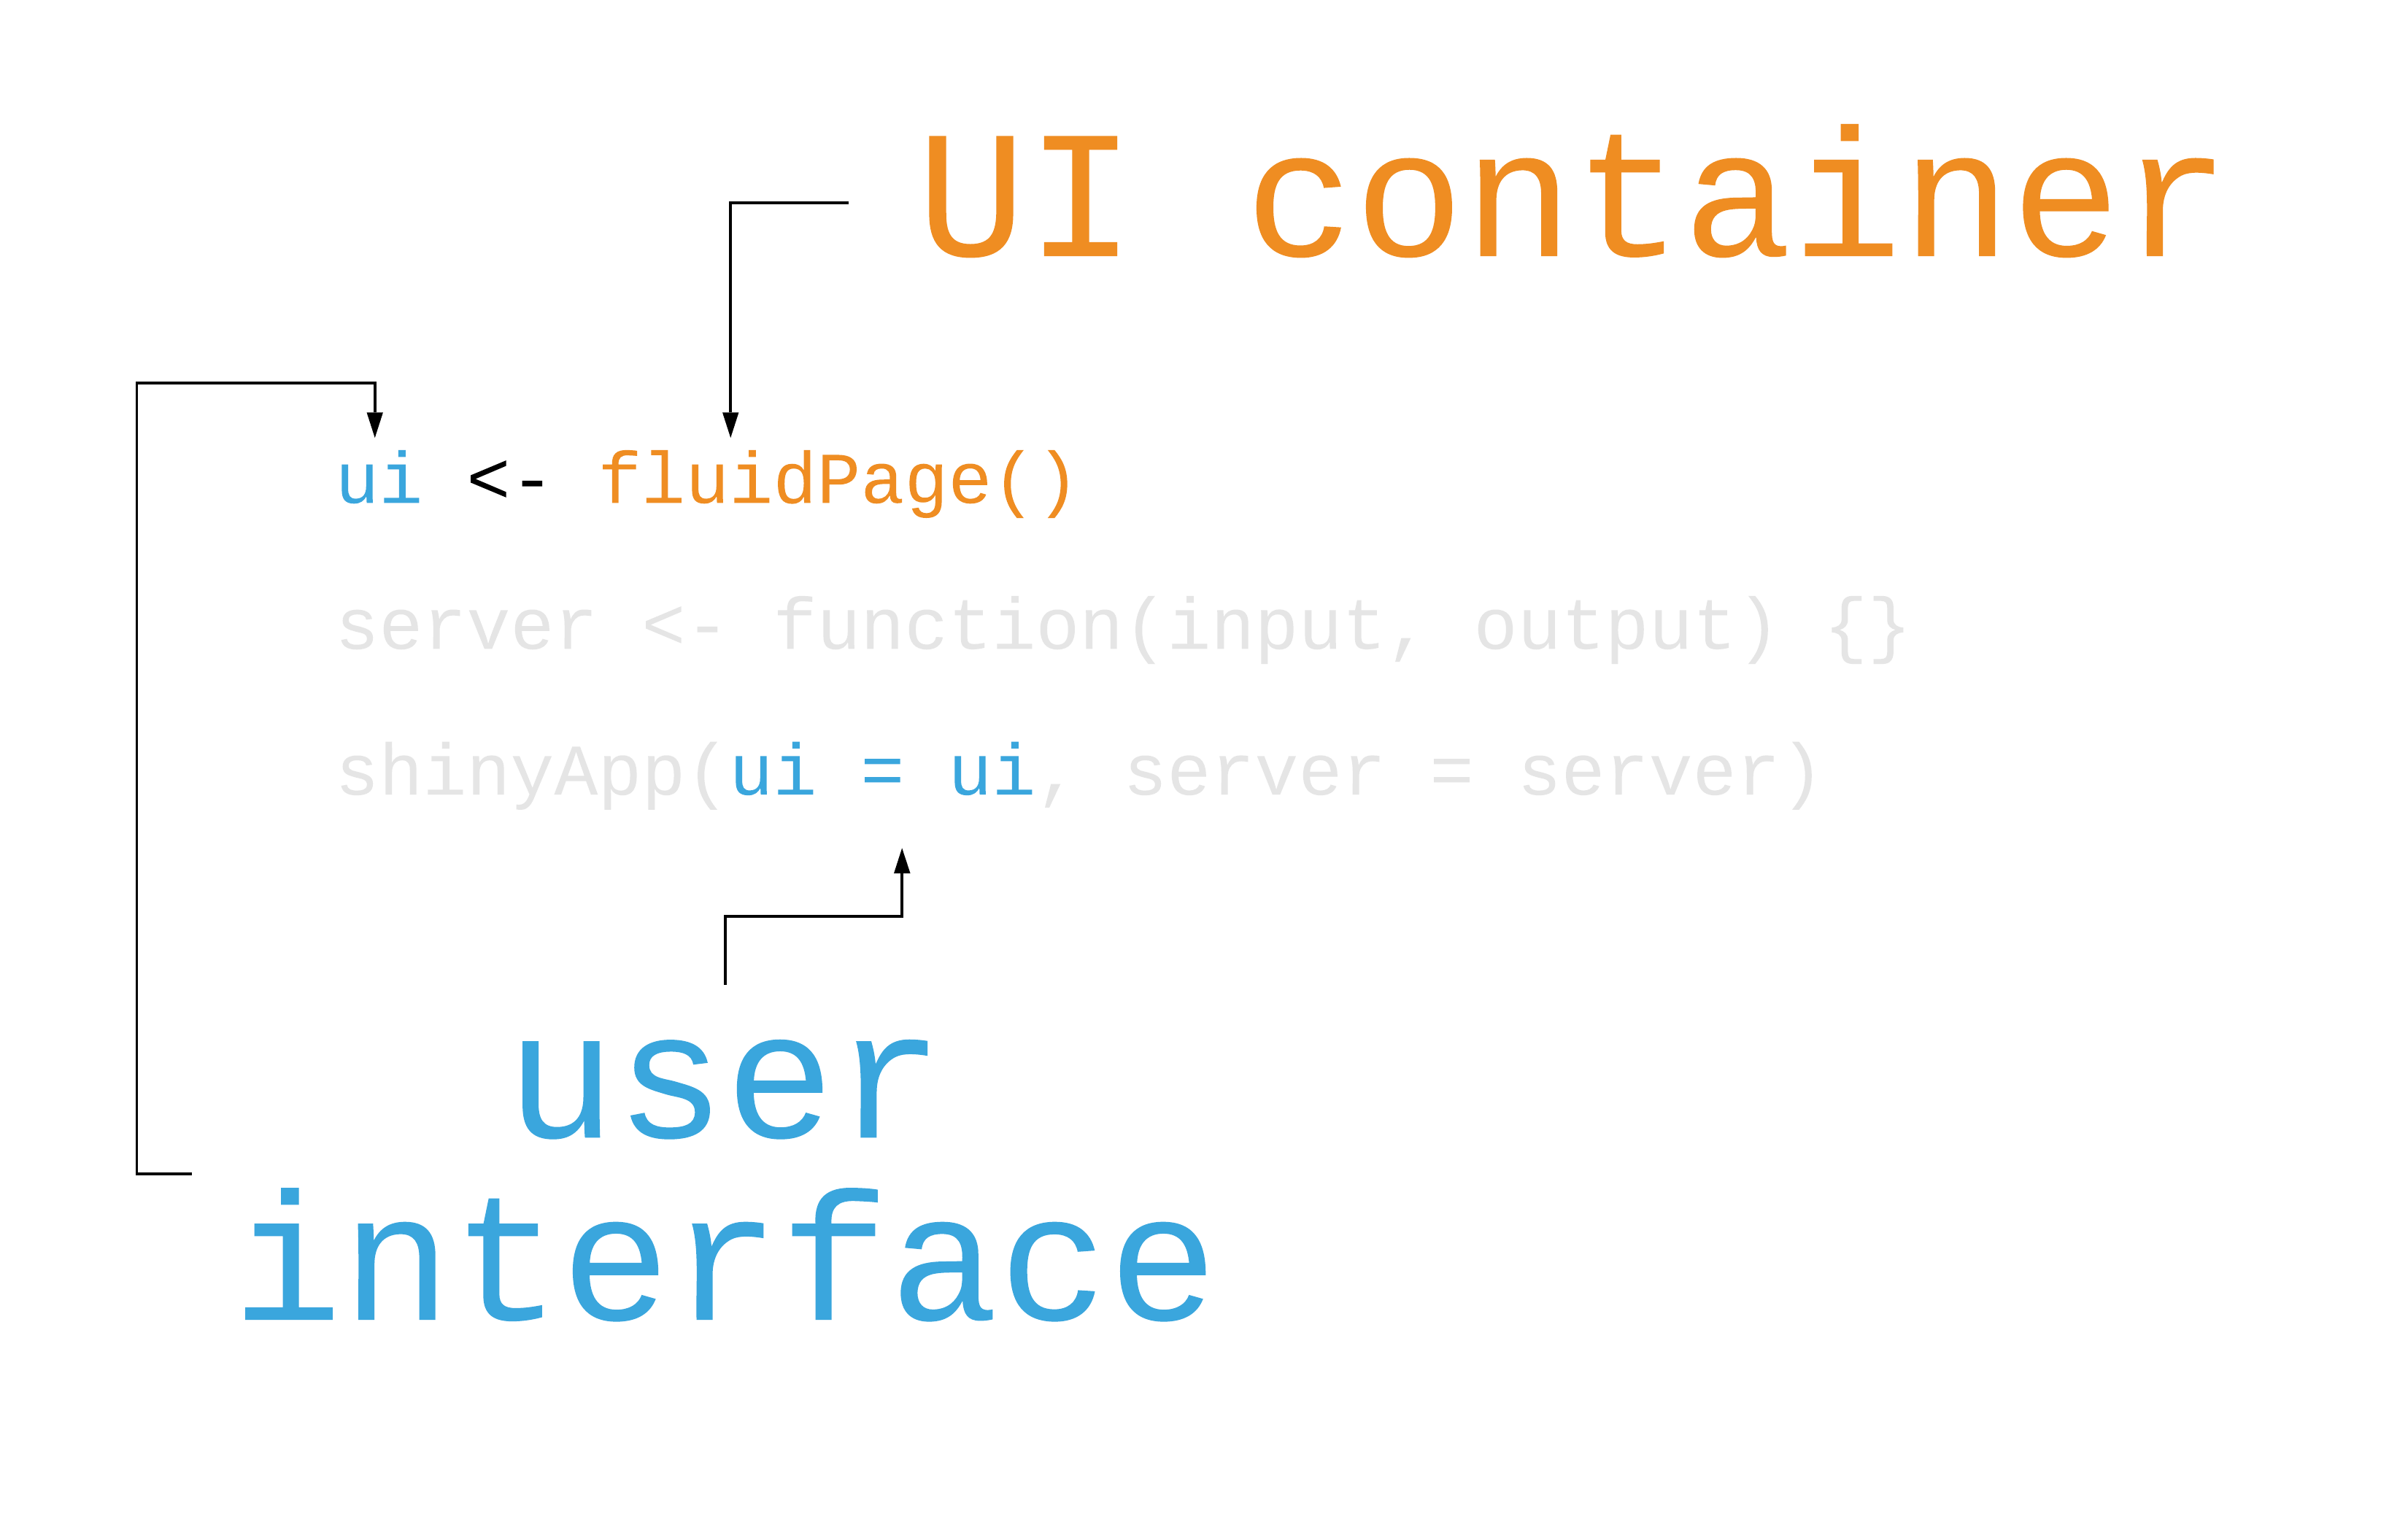
Anatomy of a shiny app

7 / 48
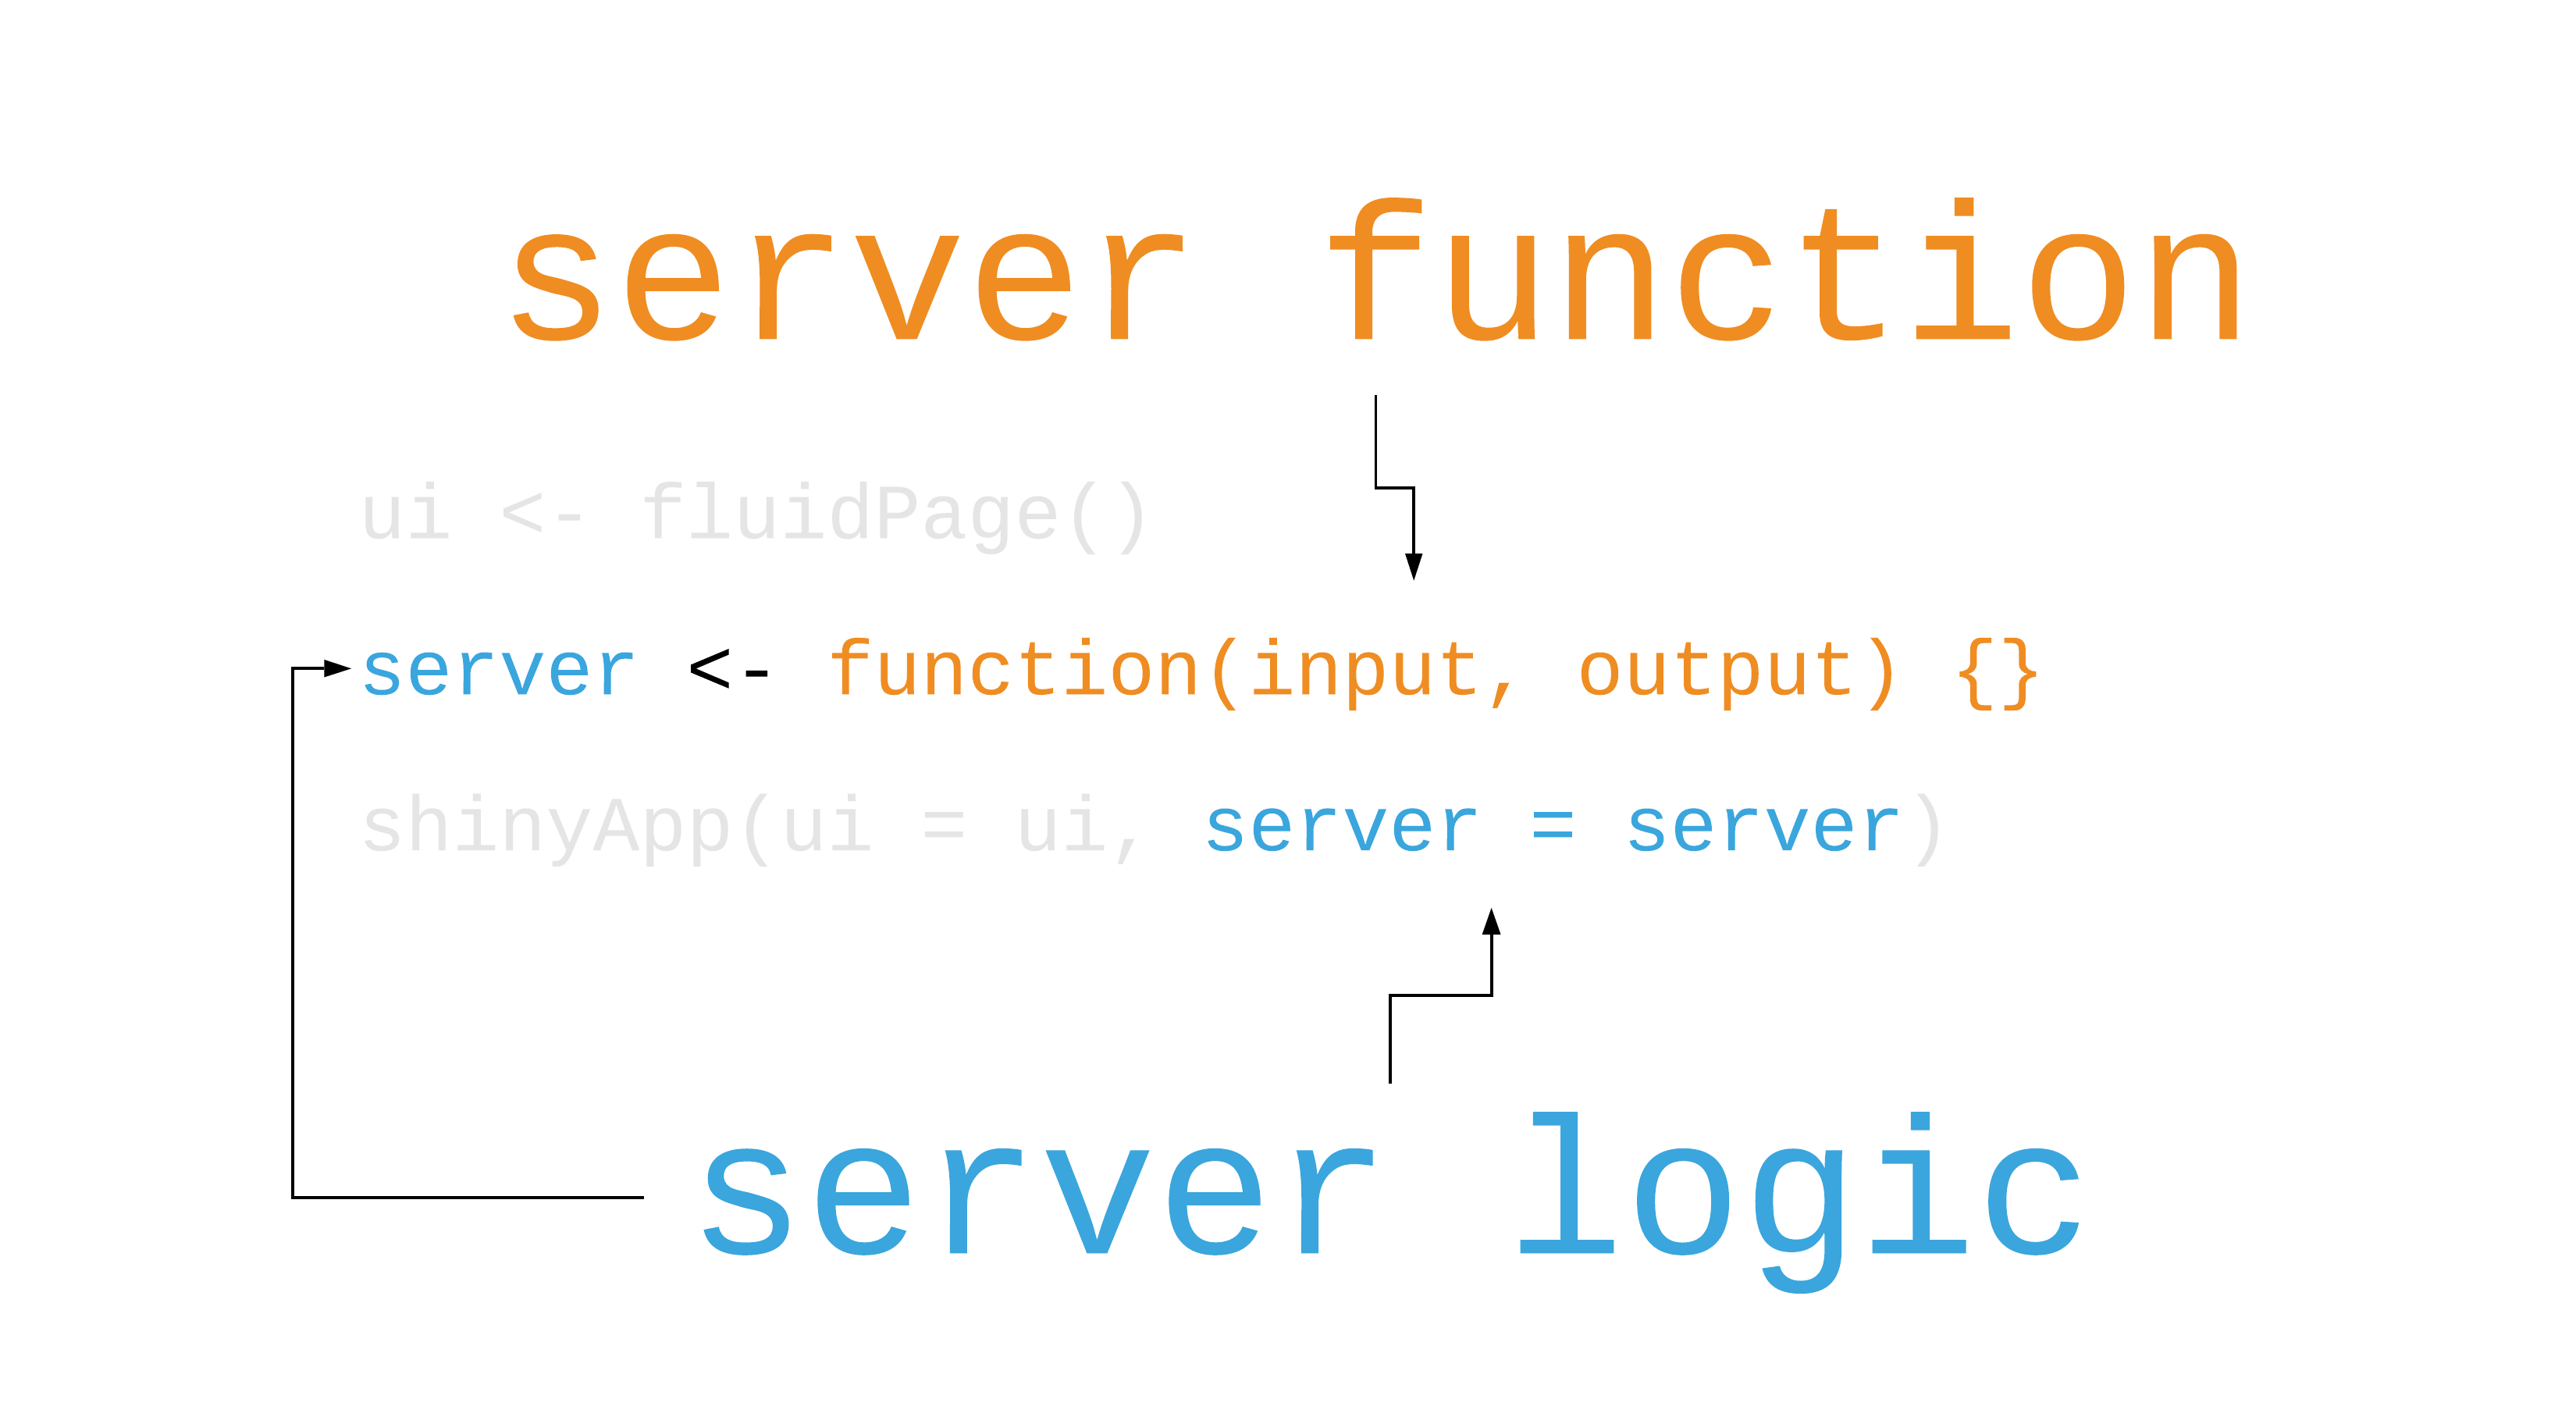
Anatomy of a shiny app
8 / 48
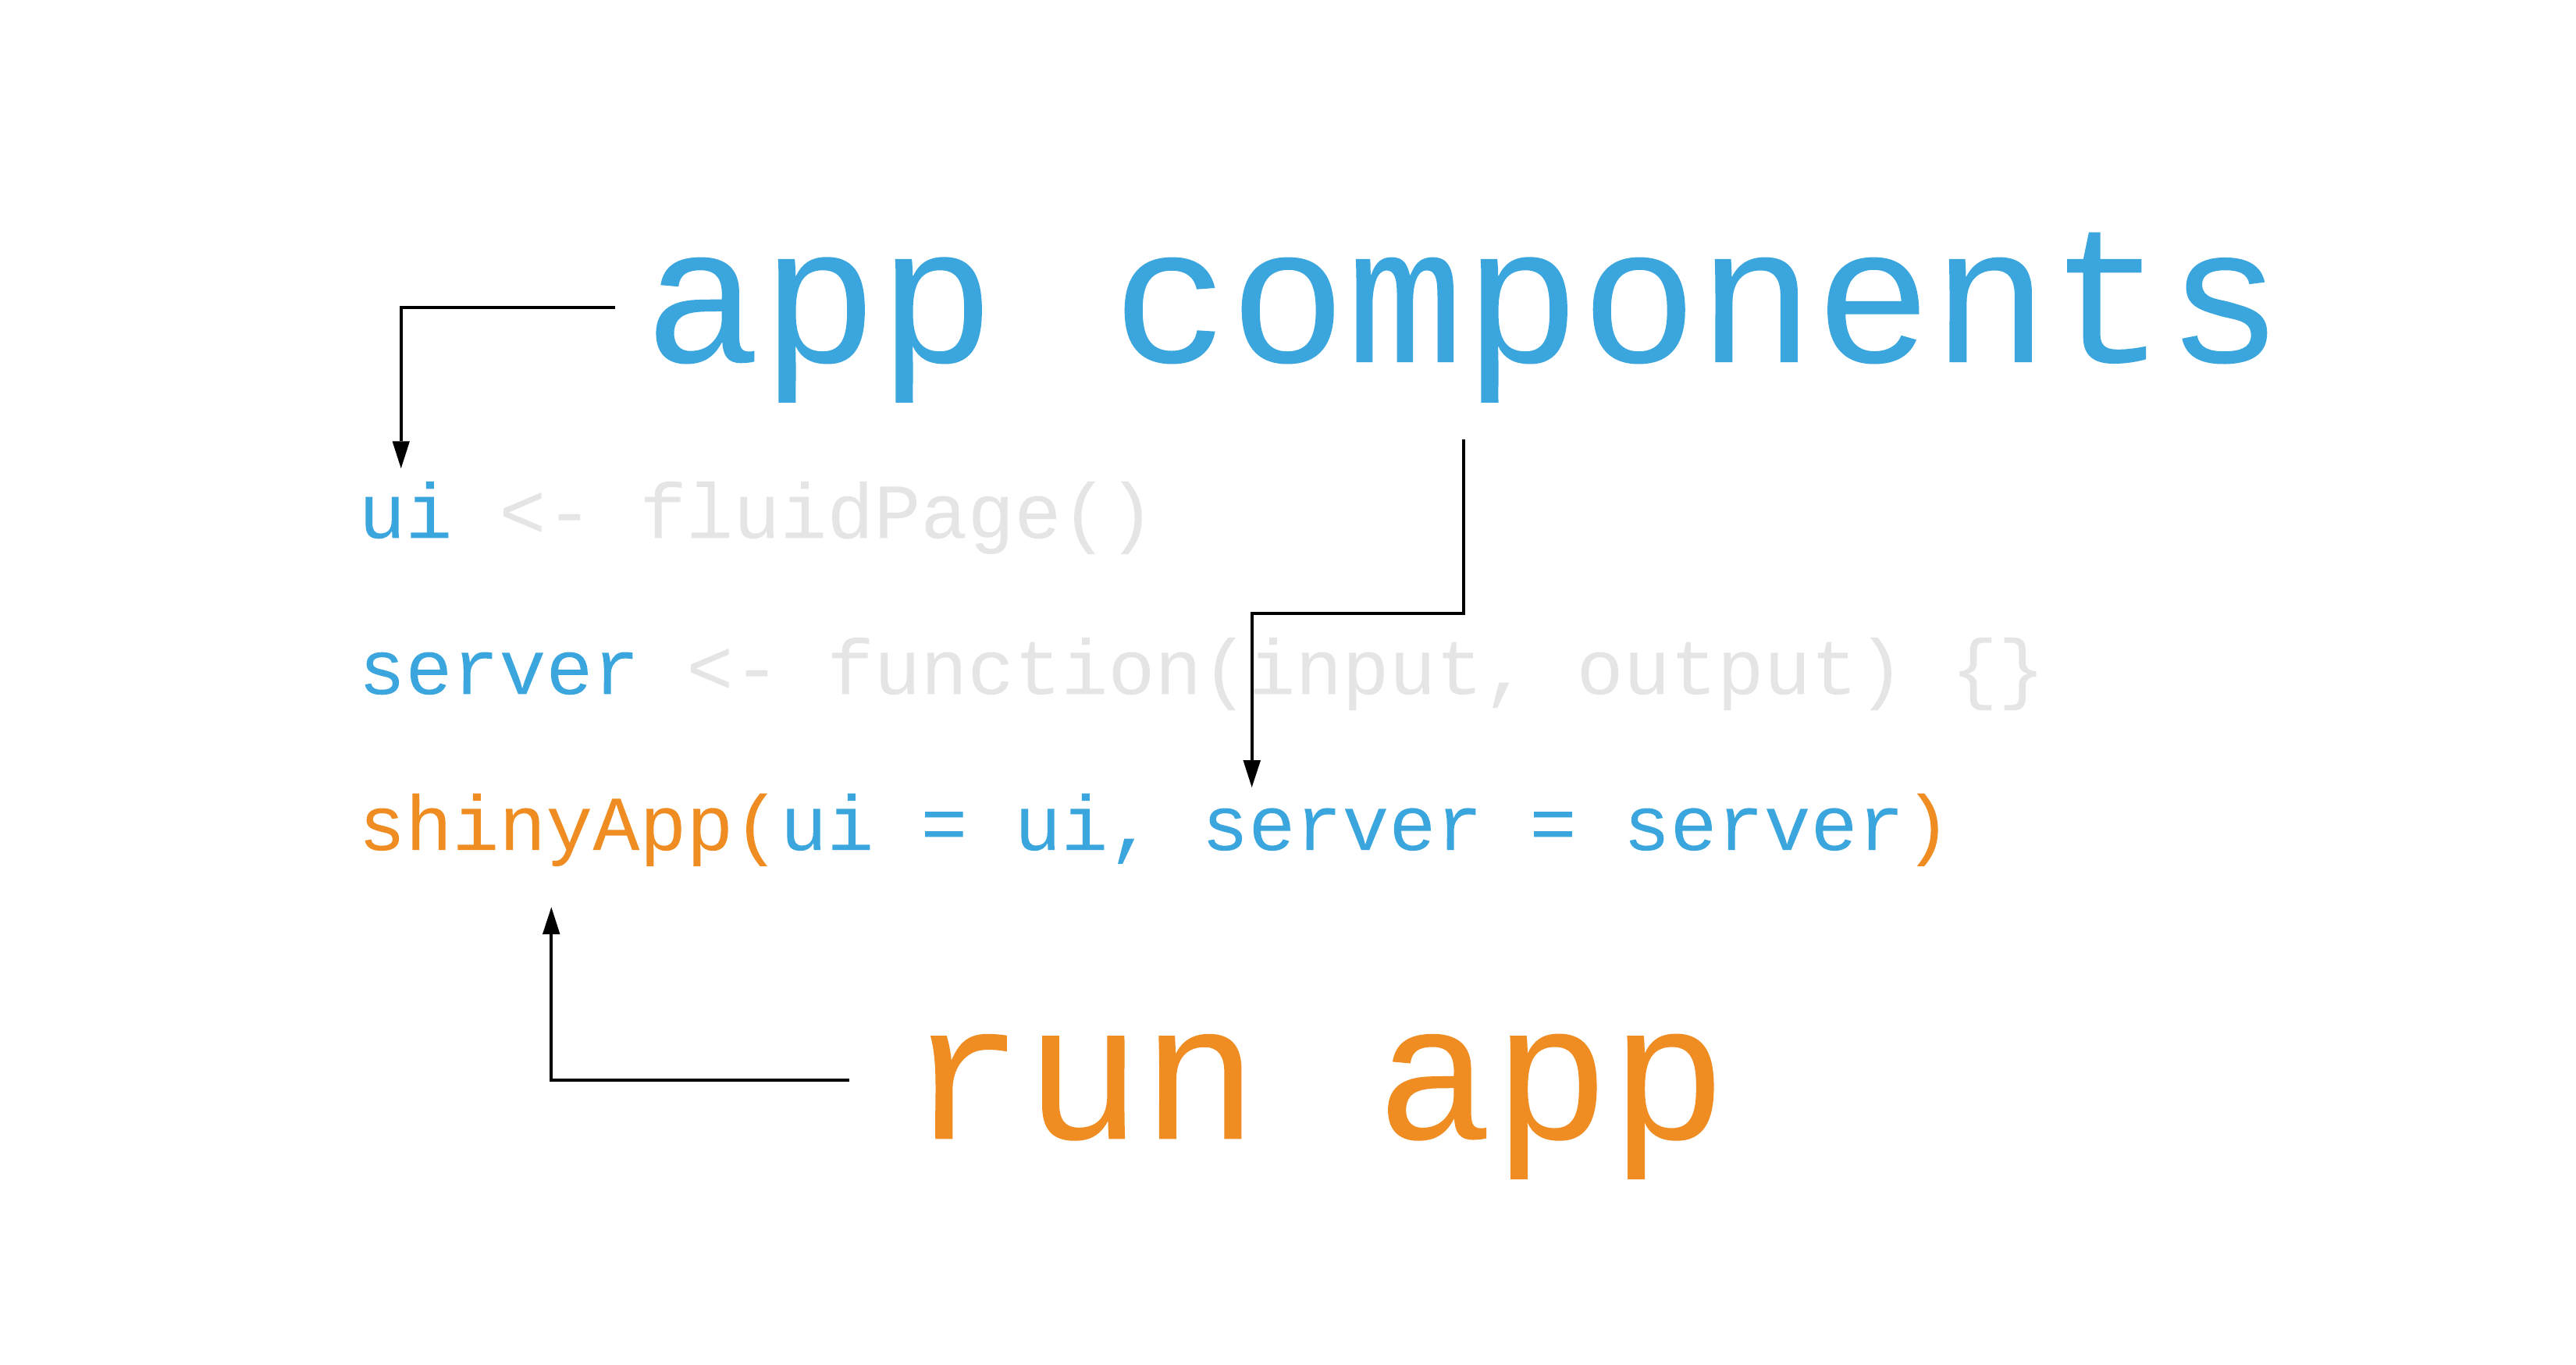
Anatomy of a shiny app
9 / 48
Anatomy of a shiny app
10 / 48
11 / 48
Your Turn 2
Open apps/movies_01.R
Try to identify the components of the app
Run the app
Stop the app
12 / 48
movies_01.R
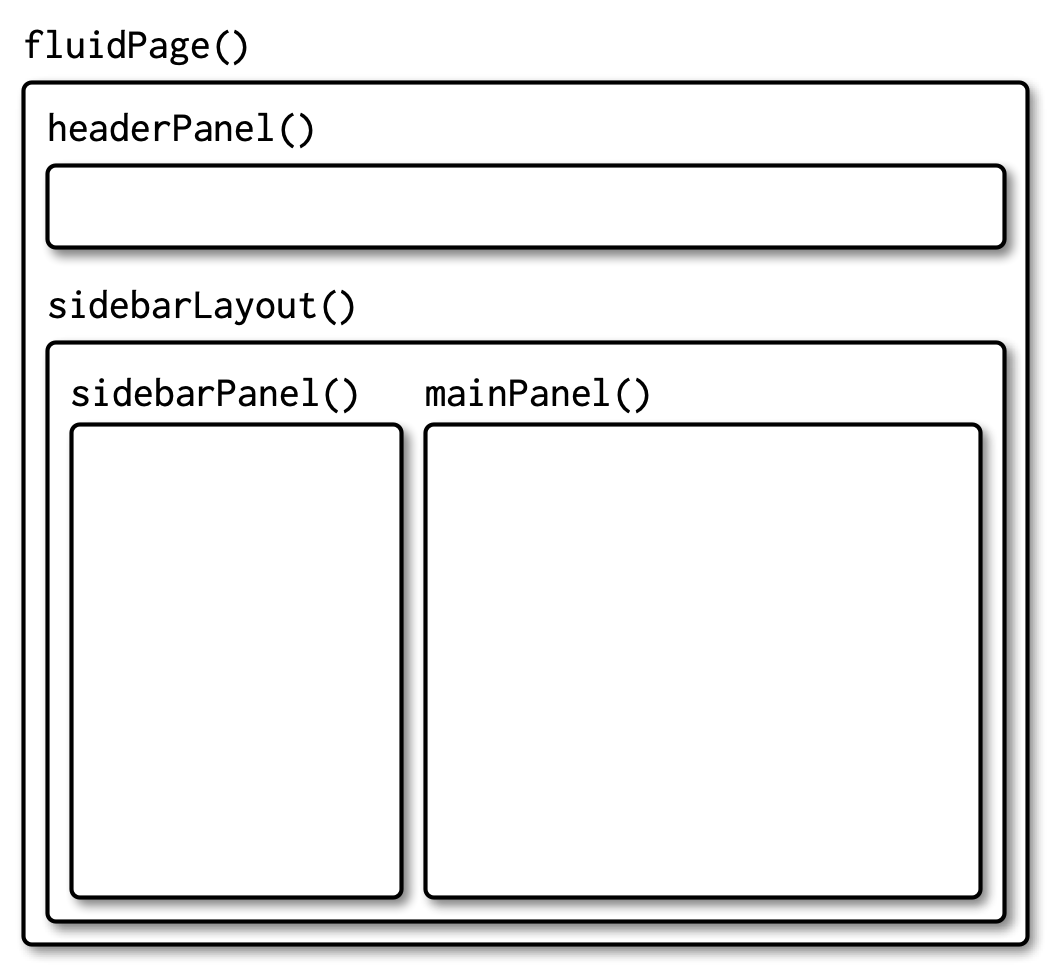 Image by Hadley Wickham
13 / 48
Sidebar layouts
ui <- fluidPage( headerPanel(), sidebarLayout( sidebarPanel( # Inputs ), mainPanel( # Outputs ) ))14 / 48
Sidebar inputs
sidebarPanel( selectInput( inputId = "y", label = "Y-axis:", choices = c("..."), selected = "audience_score" ), selectInput( inputId = "x", label = "X-axis:", choices = c("..."), selected = "critics_score" ))15 / 48
Sidebar inputs
sidebarPanel( selectInput( inputId = "y", label = "Y-axis:", choices = c("..."), selected = "audience_score" ), selectInput( inputId = "x", label = "X-axis:", choices = c("..."), selected = "critics_score" ))16 / 48
Sidebar inputs
sidebarPanel( selectInput( inputId = "y", label = "Y-axis:", choices = c("..."), selected = "audience_score" ), selectInput( inputId = "x", label = "X-axis:", choices = c("..."), selected = "critics_score" ))17 / 48
Main panel outputs
mainPanel( plotOutput(outputId = "scatterplot"))18 / 48
Main panel outputs
mainPanel( plotOutput(outputId = "scatterplot"))19 / 48
Server
server <- function(input, output) { output$scatterplot <- renderPlot({ ggplot( data = movies, aes_string(x = input$x, y = input$y) ) + geom_point() })}20 / 48
Server
server <- function(input, output) { output$scatterplot <- renderPlot({ ggplot( data = movies, aes_string(x = input$x, y = input$y) ) + geom_point() })}21 / 48
Main panel outputs
mainPanel( plotOutput(outputId = "scatterplot"))22 / 48
Server
server <- function(input, output) { output$scatterplot <- renderPlot({ ggplot( data = movies, aes_string(x = input$x, y = input$y) ) + geom_point() })}23 / 48
Server
server <- function(input, output) { output$scatterplot <- renderPlot({ ggplot( data = movies, aes_string(x = input$x, y = input$y) ) + geom_point() })}24 / 48
Sidebar inputs
sidebarPanel( selectInput( inputId = "y", label = "Y-axis:", choices = c("..."), selected = "audience_score" ), selectInput( inputId = "x", label = "X-axis:", choices = c("..."), selected = "critics_score" ))25 / 48
Server
server <- function(input, output) { output$scatterplot <- renderPlot({ ggplot( data = movies, aes_string(x = input$x, y = input$y) ) + geom_point() })}26 / 48
Run the app
shinyApp(ui = ui, server = server)27 / 48
Your Turn 3
Add new select menu to color the points. Use the following arguments: inputId = "z", label = "Color by:", choices = c("title_type", "genre", "mpaa_rating", "critics_rating", "audience_rating"), selected = "mpaa_rating"
Use this variable in the aesthetics of the ggplot function as the color argument
Run the app in the Viewer Pane
28 / 48
Your Turn 3 (solution: movies_02.R)
# in sidebarPanel()selectInput( inputId = "z", label = "Color by:", choices = c("..."), # truncated selected = "mpaa_rating")# in server <- function(input, output) {}output$scatterplot <- renderPlot({ ggplot( data = movies, aes_string(x = input$x, y = input$y, color = input$z) ) + geom_point()})29 / 48
30 / 48
Your Turn 4
Add a slider input to control the alpha level of the scatterplot points. Don't forget to label it!
Set min to 0 and max to 1. Choose a default for value
Use the value from this input in the plot
Run the app
31 / 48
Your Turn 4 (solution: movies_03.R)
# in sidebarPanel()sliderInput( inputId = "alpha", label = "Alpha:", min = 0, max = 1, value = 0.5)# in server <- function(input, output) {}output$scatterplot <- renderPlot({ ggplot( data = movies, aes_string(x = input$x, y = input$y, color = input$z) ) + geom_point(alpha = input$alpha)})32 / 48
33 / 48
Your Turn 5
Add a new output in server using DT::renderDataTable(). Inside of the render function, create a data table with DT::datatable()
Set data = movies[, 1:7], options = list(pageLength = 10), and rownames = FALSE
Add the output to mainPanel() in ui using DT::dataTableOutput()
Run the app
34 / 48
Your Turn 5 (solution: movies_04.R)
# in mainPanel()DT::dataTableOutput(outputId = "moviestable")# in server <- function(input, output) {}output$moviestable <- DT::renderDataTable({ DT::datatable( data = movies[, 1:7], options = list(pageLength = 10), rownames = FALSE )})35 / 48
Your Turn 6
Add a title to your app with headerPanel()
Make the input choices nicer by making the vector named, e.g. choices = c("IMDB rating" = "imdb_rating", ...)
Clean up your axes titles with:
str_replace_all() to replace _ with " "
str_to_title() to change to title case
36 / 48
Your Turn 6
str_replace_all() takes three arguments,
str_replace_all( string = "lord_of_the_rings", pattern = "_", replacement = " " )str_to_title() converts the case of a string to title case.
str_to_title("lord of the rings")37 / 48
Your Turn 6 (solution: movies_05.R)
# in fluidPage()headerPanel("Movie browser")# in sidebarPanel()selectInput( ..., choices = c( "IMDB rating" = "imdb_rating", "IMDB number of votes" = "imdb_num_votes", "Critics Score" = "critics_score", "Audience Score" = "audience_score", "Runtime" = "runtime" ))38 / 48
Your Turn 6 (solution: movies_05.R)
# in server <- function(input, output) {}output$scatterplot <- renderPlot({ ggplot( data = movies, aes_string(x = input$x, y = input$y, color = input$z) ) + geom_point(alpha = input$alpha) + labs( x = str_to_title(str_replace_all(input$x, "_", " ")), y = str_to_title(str_replace_all(input$y, "_", " ")), color = str_to_title(str_replace_all(input$z, "_", " ")) )})39 / 48
Directory Structure
|--name_of_app |-- app.R|--name_of_app |-- ui.R |-- server.R |-- global.R |-- www |-- image.png40 / 48
Sharing your app
41 / 48
Sharing your app
shinyapps.io
42 / 48
Sharing your app
shinyapps.io
Shiny Server
43 / 48
Sharing your app
shinyapps.io
Shiny Server
RStudio Connect or Shiny Server Pro
44 / 48
Your Turn 7
Create folder called movies_app
Move any of the (working) app files into this folder, along with movies.Rdata
Go to http://shinyapps.io. Sign up for an account (instructions).
45 / 48
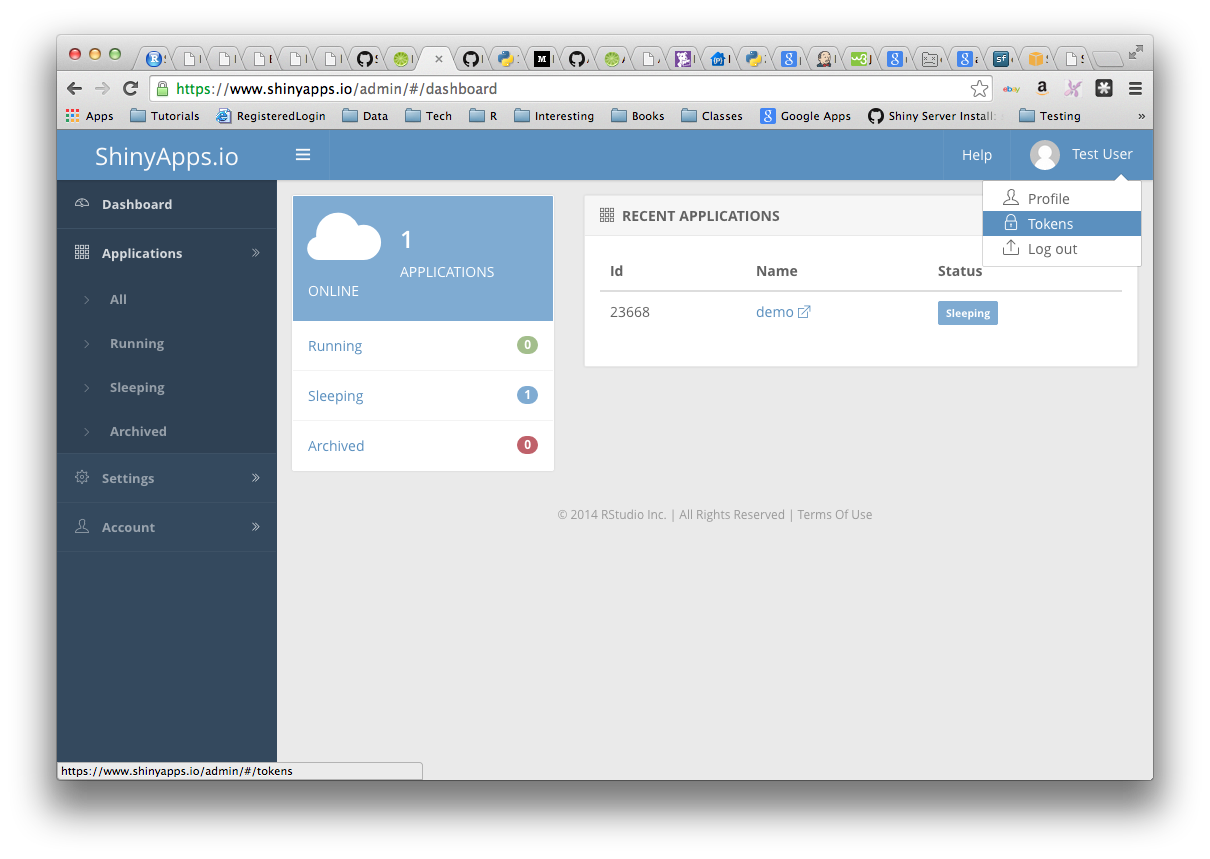
Your turn 7
Click on the 'Tokens' option under your username (upper right corner)
46 / 48
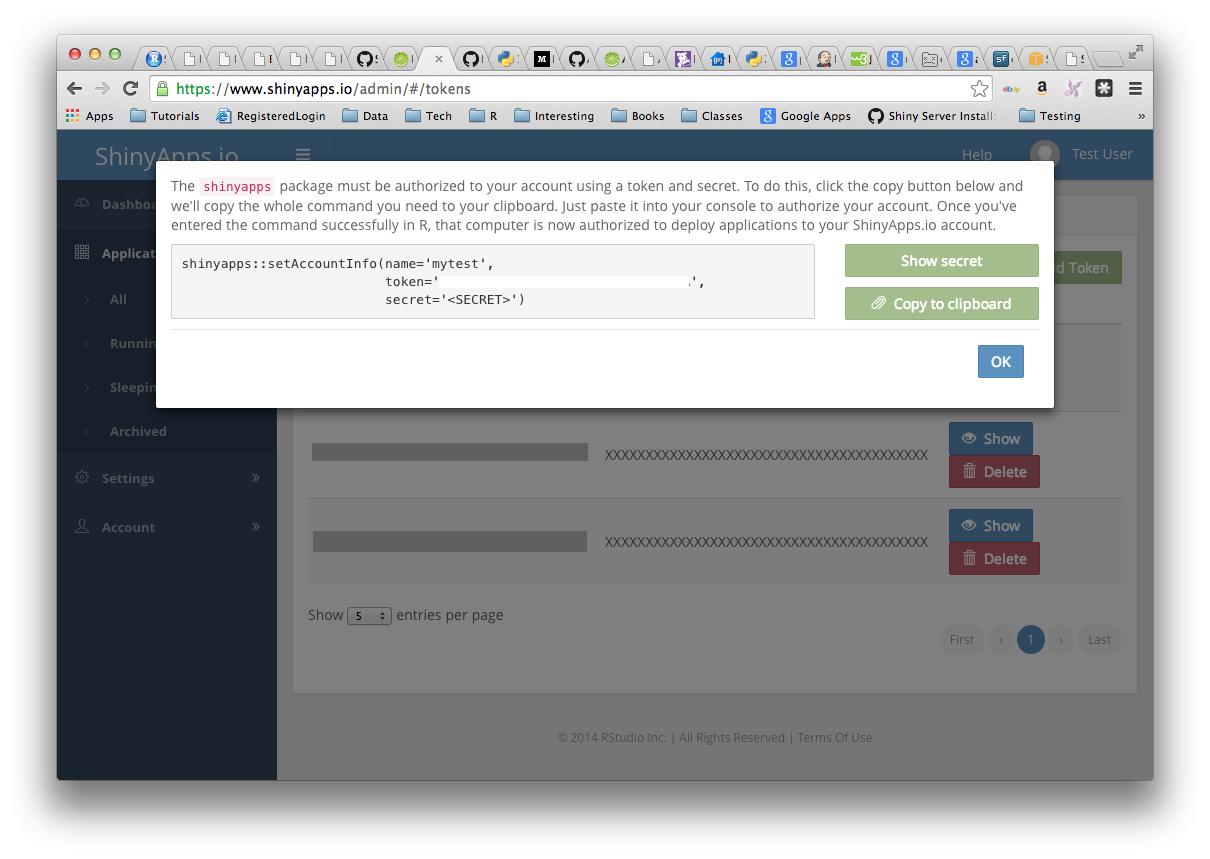
Your Turn 7
Click 'Show' button on the 'Token' page
Copy this to the clipboard, paste it into the console in the RStudio IDE, hit Enter
47 / 48
Resources
Shiny Website: A collection of articles on Shiny
Mastering Shiny: A Work-in-progress book from Hadley Wickham
48 / 48