Welcome!
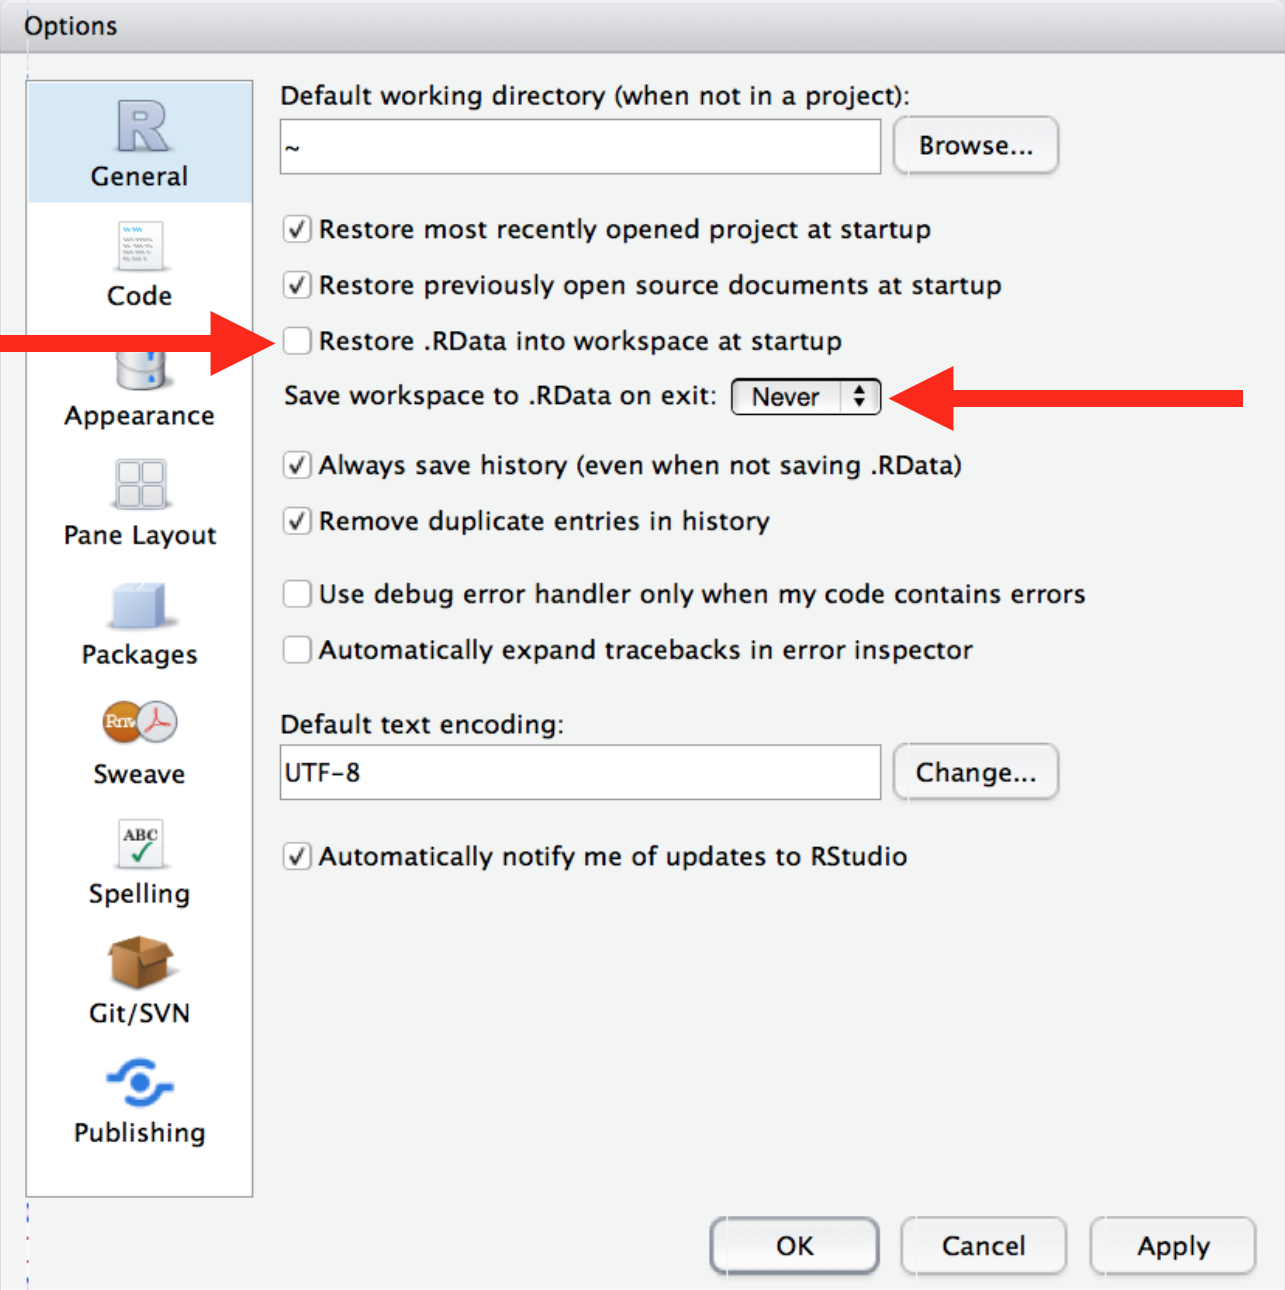
Change Settings
Keyboard shortcut to open settings⌘ + , in Mac OS,ctrl + , in Windows
✓ - Uncheck "Restore .RData into work space at start up"
✓ - Set "Save work space to .Rdata on exit" to "Never"
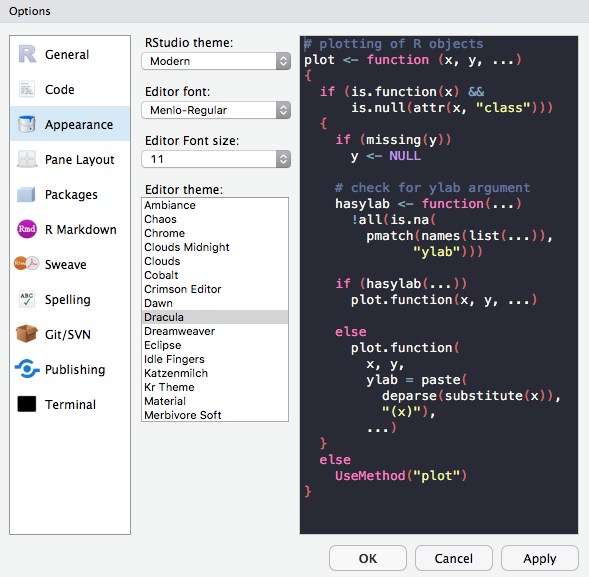
Change Appearance
RStudio themes
Fonts
Font Sizes
Editor Themes
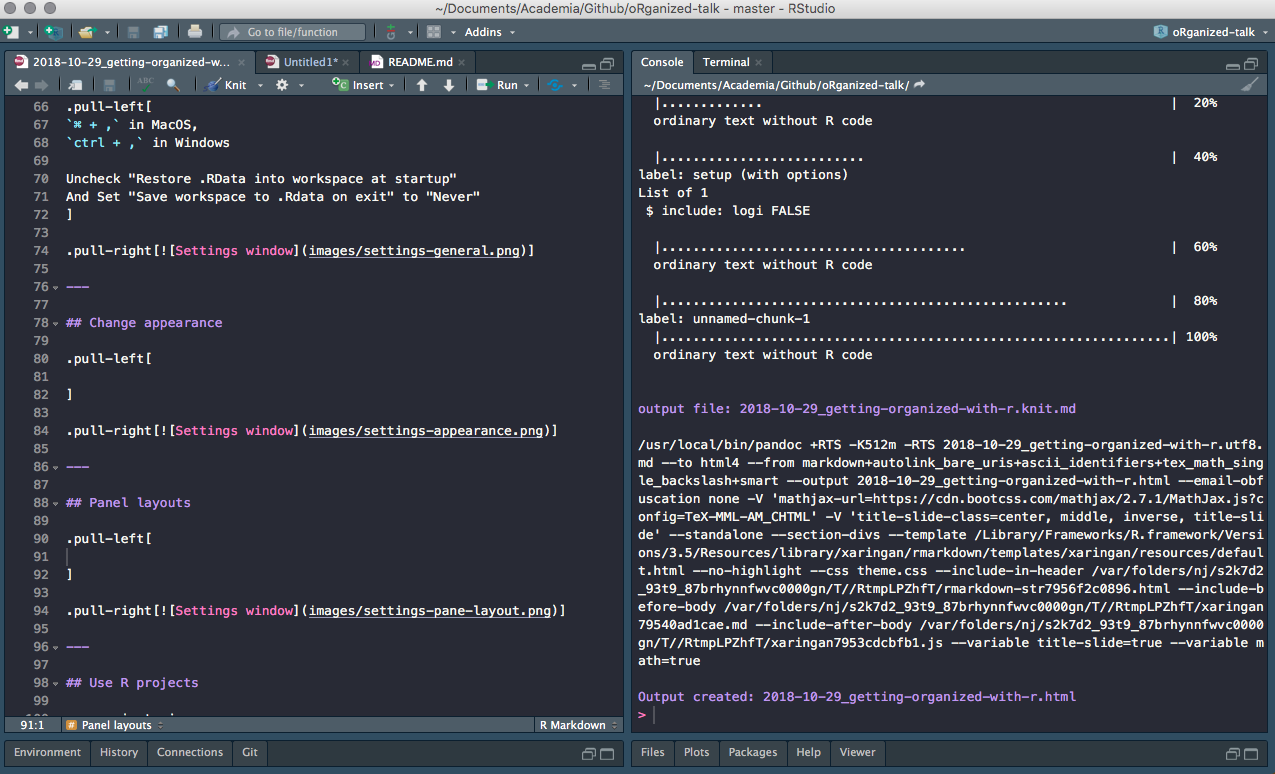
Pane layouts
Change the layout of the panes
Source on top?
Source down to the right?
It's all up to you!
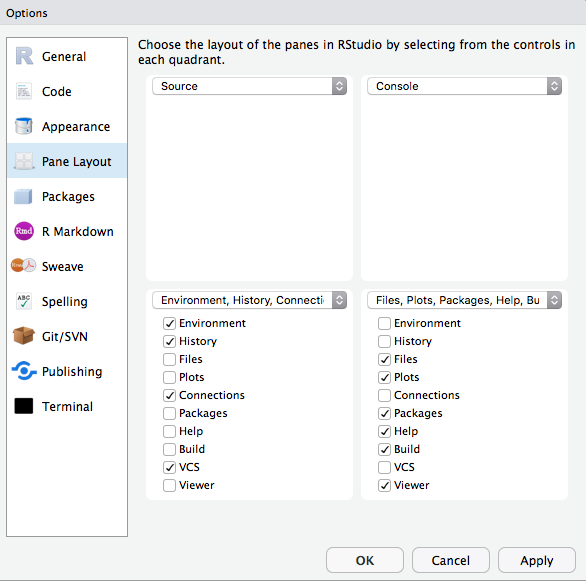
Pane layouts
Some like having both source and console open
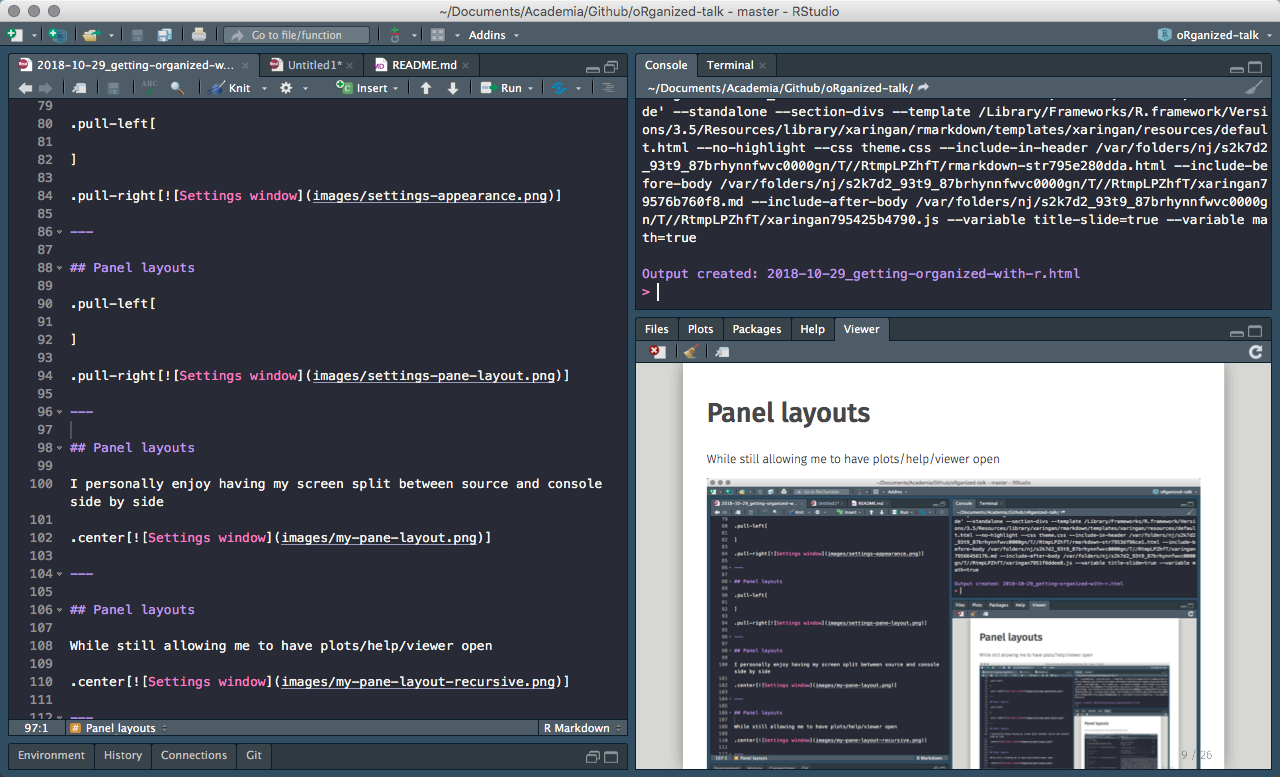
Pane layouts
...while still allowing to have viewer open
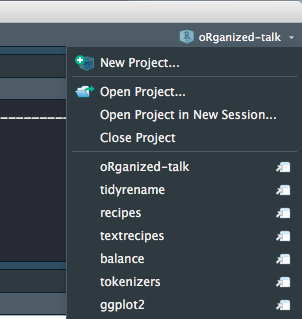
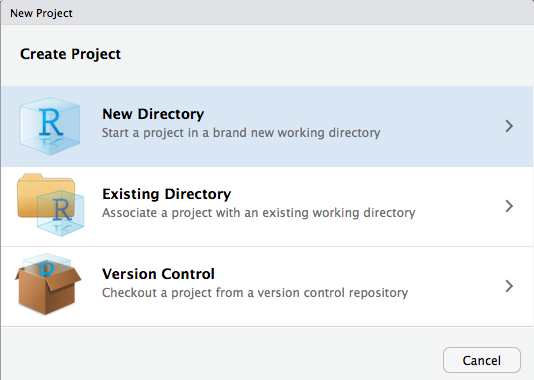
RStudio Projects - Creation 1 / 4
Click File > New Project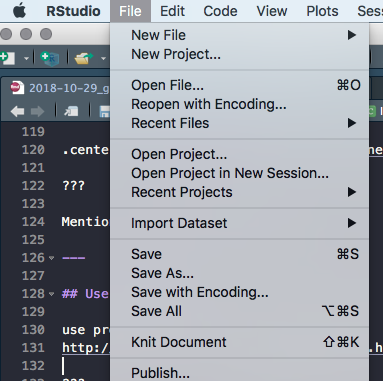
Or click on the upper right
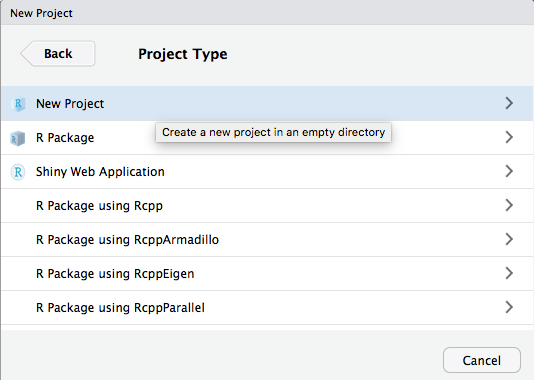
RStudio Projects - Creation 2 / 4
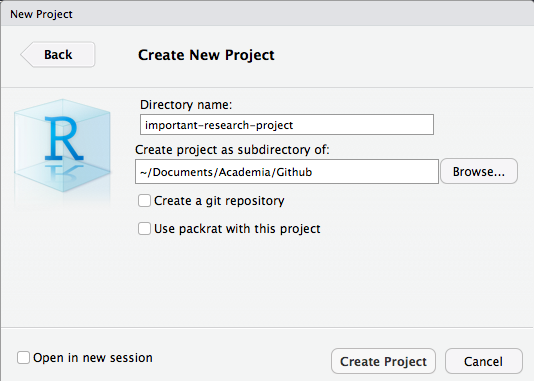
RStudio Projects - Creation 3 / 4
RStudio Projects - Creation 4 / 4
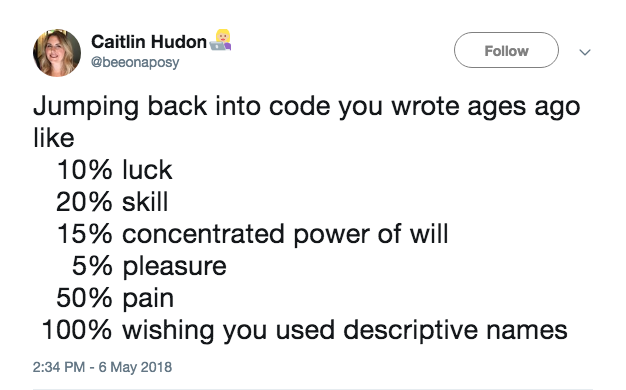
Naming Things
Updating R and RStudio
The most recent version of R can be downloaded from The Comprehensive R Archive Network (CRAN)

How to ask for help (datapasta and reprex)
The reprex package helps you create a reproducible example
datapasta lets you easy copy + paste small samples of data into RStudio
How to ask for help (reprex)
Check out the package website and RStudio webinar on creating reproducible examples
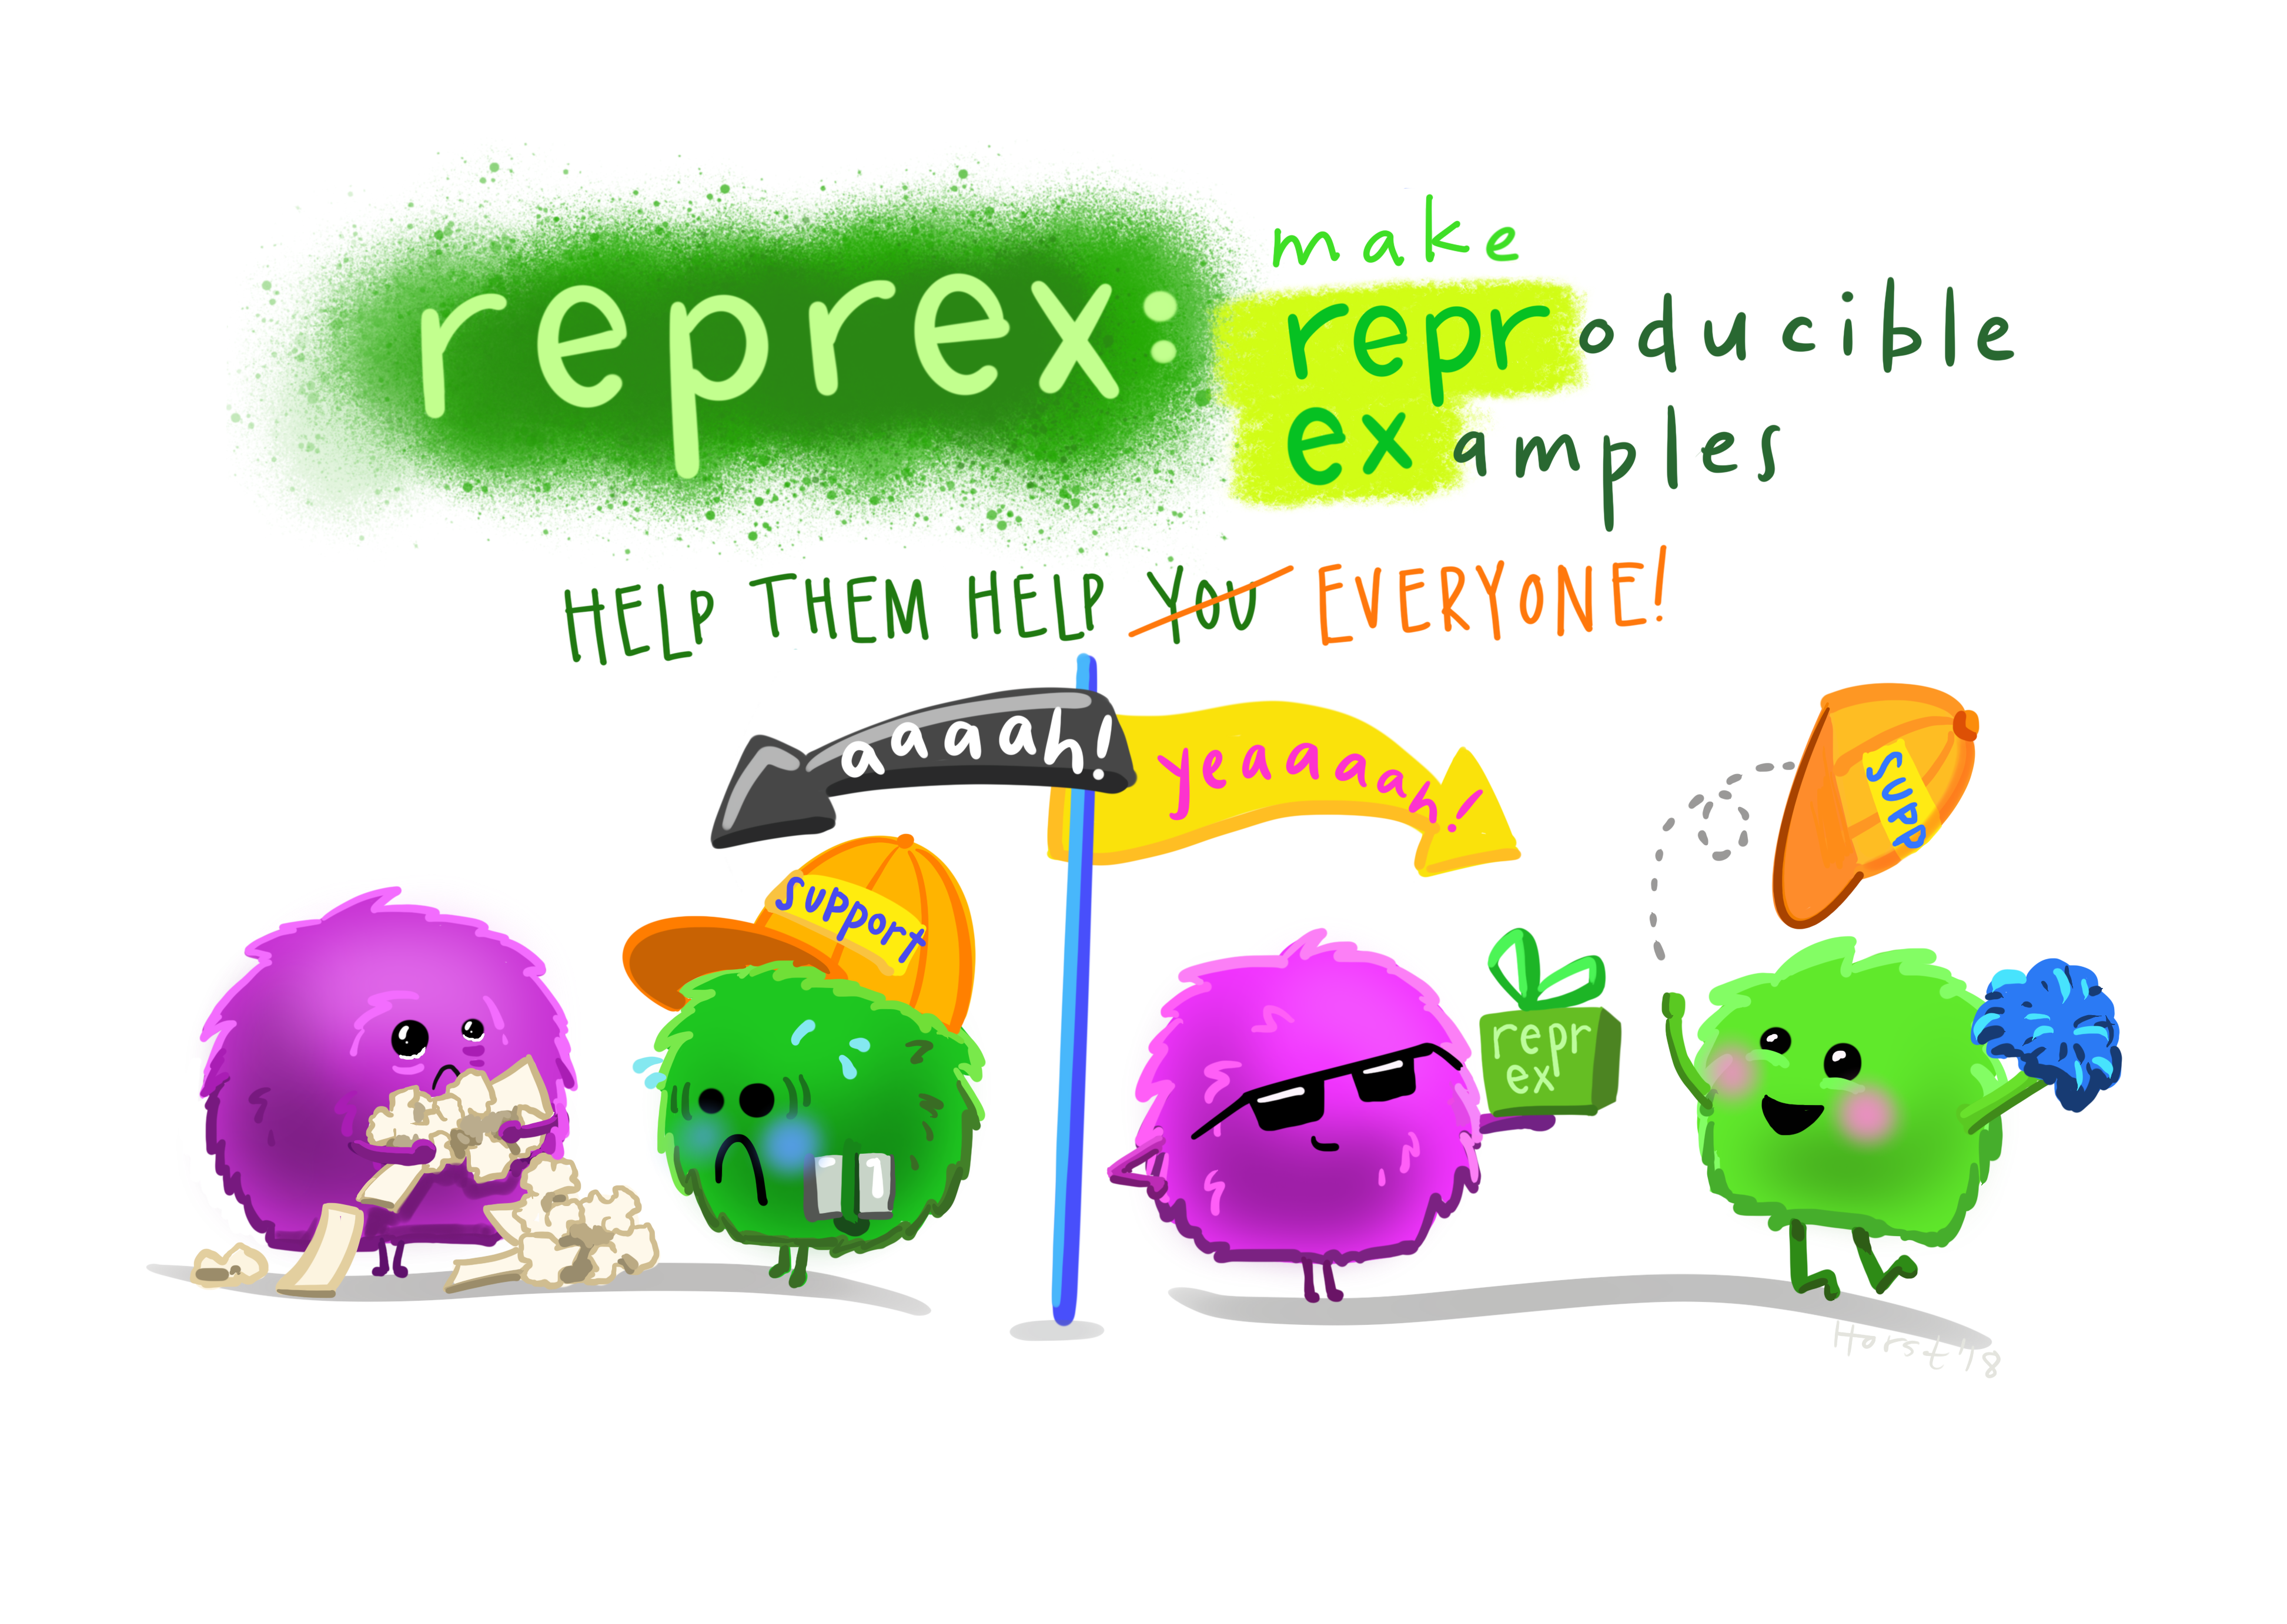 Art by Allison Horst
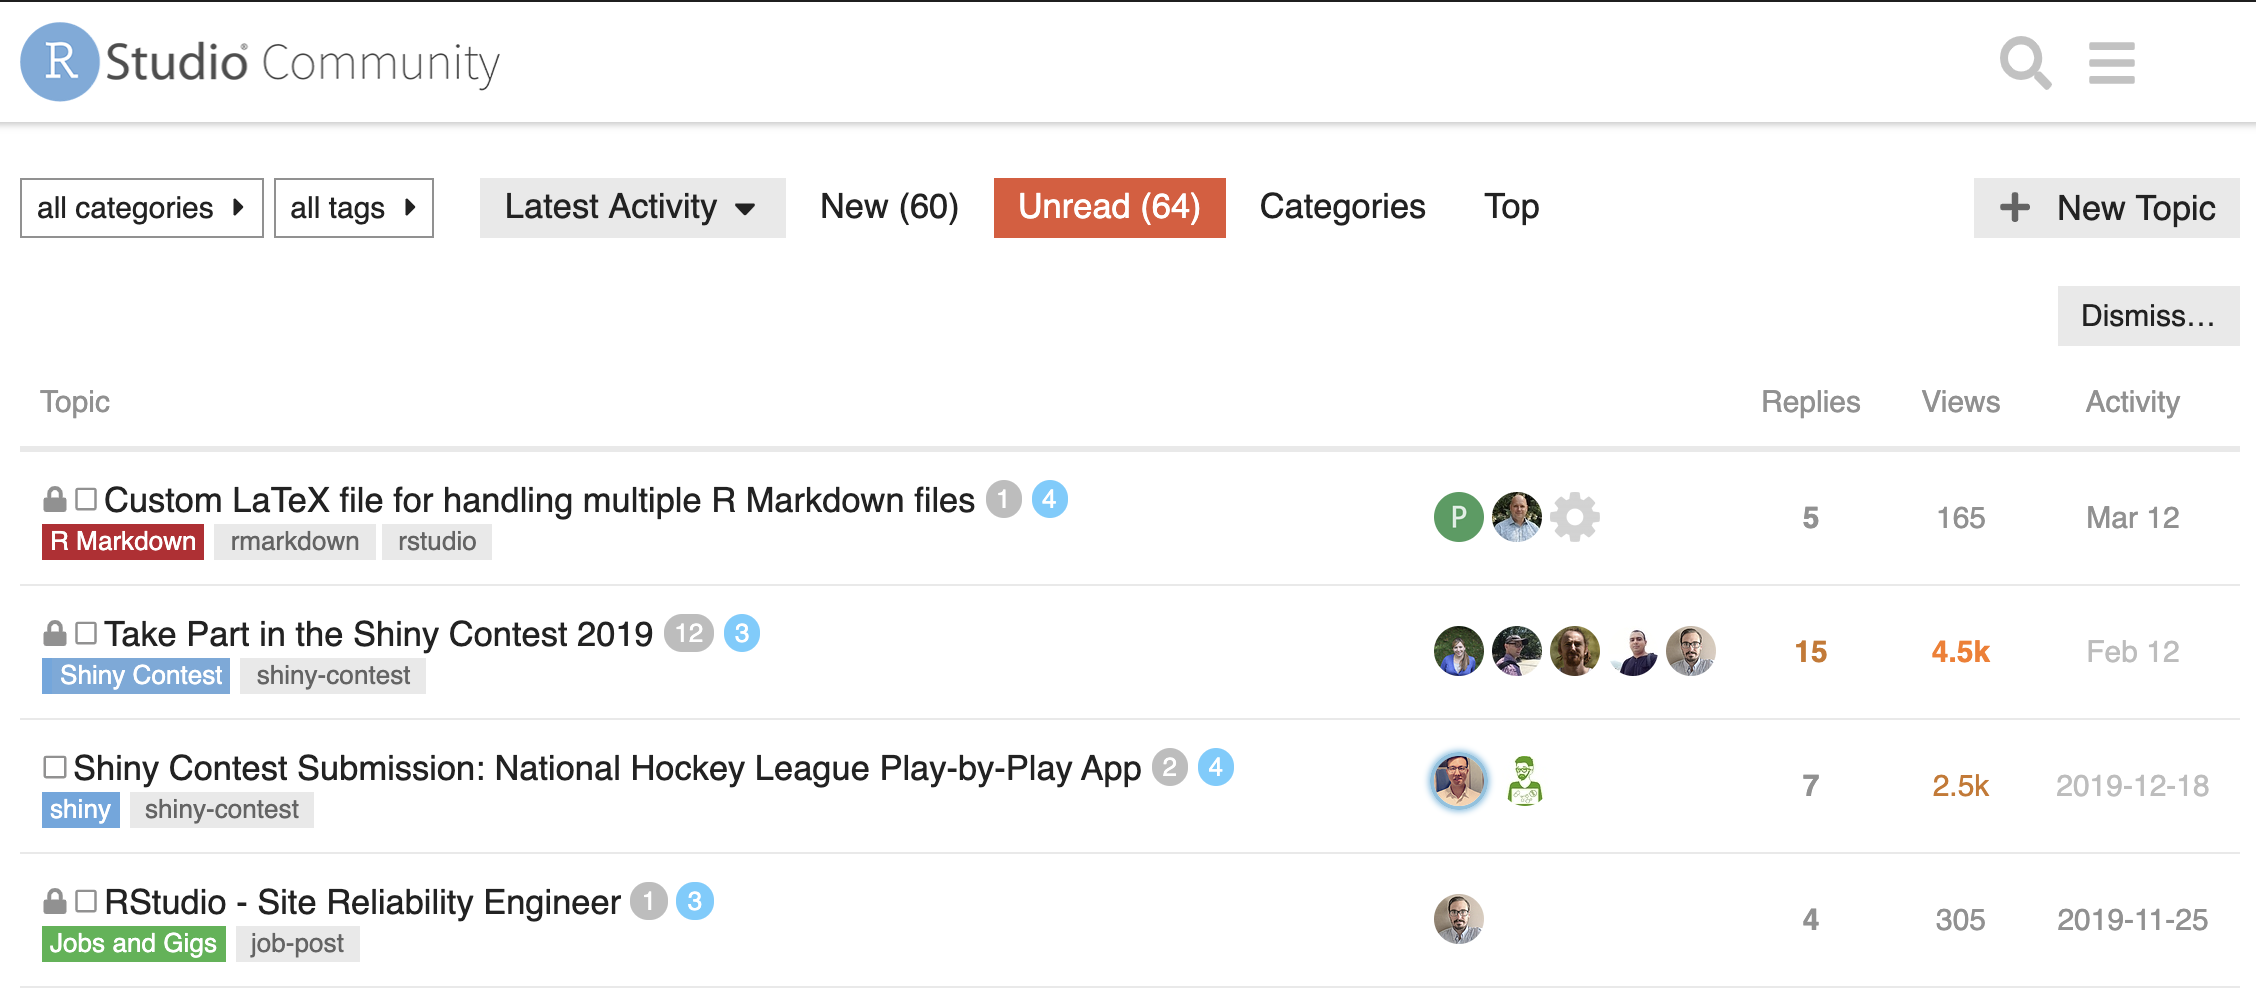
Where to get help
RStudio has a helpful community if you have questions (everyone does!)
RStudio Community:
RStudio has a dedicated forum for questions related to R and RStudio: https://community.rstudio.com/
Where else to get help
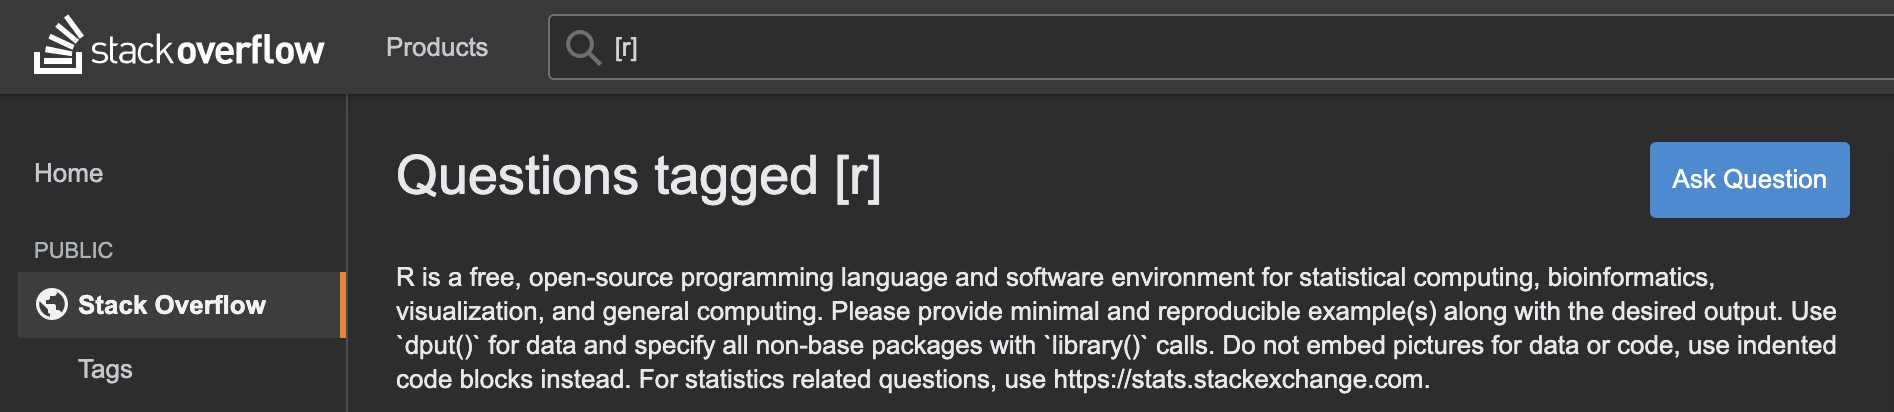
Stack Overflow
Check out the questions tagged r on Stack Overflow: https://stackoverflow.com/questions/tagged/r
#rstats on Twitter
If you have a Twitter account, check out #rstats: https://twitter.com/hashtag/rstats

Art by Allison Horst